 By Michael McCann
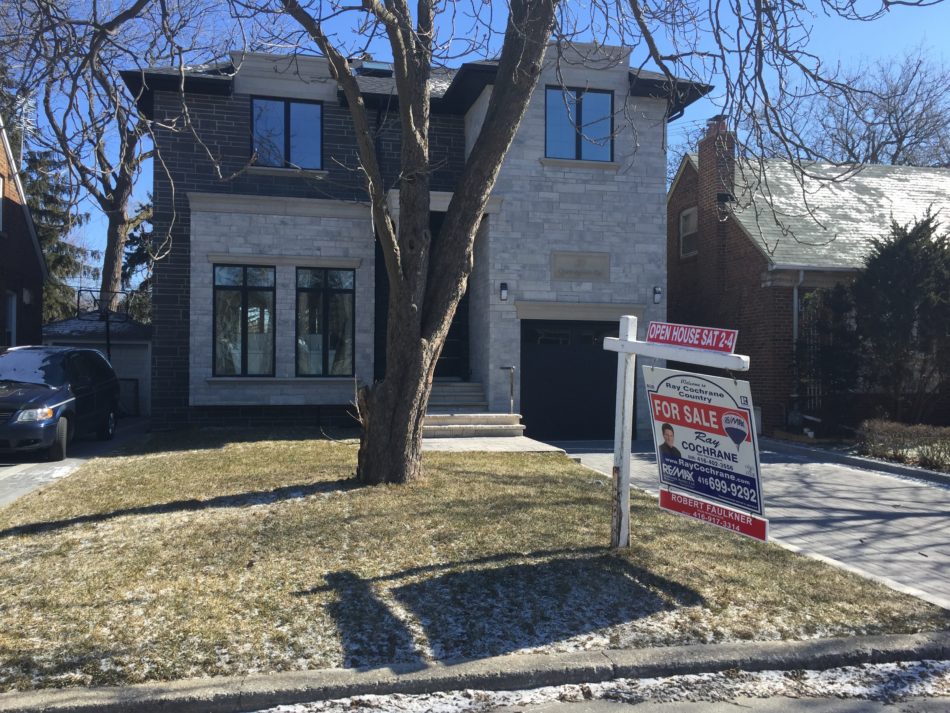
April continued to be one of the busiest spring housing markets I have experienced in years.
To give you some insight of how crazy the housing market is, a fixer upper house at Yonge and Lawrence got 72 offers…yes 72.
The house was listed for $699,000 and it sold for $1,366,000, which is 195% over asking price.
The new buyers must certainly have deep pockets as they are still looking to do an additional $500,000 in renovations.
But, back to Birchcliff. Homes were selling quickly with sales averaging nine days and the longest taking a mere 34 days.
Our neighbourhood average house prices are increasing, but in a direct comparison to last April it may not show it.
Last April we had four homes sell for over a million and with one property selling for over $1.8 million.
However, if we statistically balance April 2013 to April 2014 the average sold price was $565,000 compared to $616,243 for last month.
Birchcliff – Cliffside Home Sales in April 2014 – 37 homes sold
Source: Toronto Real Estate Board. Excludes commercial properties, condos and vacant land.
Birchcliff/Cliffside
- April 2013 we had 45 homes sold while April of this year 37 homes changed hands – down 21.6 percent
- April 2013 the average sold price was $620,749 while in April 2014 the average sold price came in at $616,243 – a decrease of less than 1 percent
- April 2013 it took on average 12 days to sell and in April 2014 homes in Birchcliff it was nine days.
Toronto Real Estate Board
- 9,535 sales in April 2013 with April 2014 showing 9,706 sales – up 1.8%
- $524,868 average selling price April 2013 with April 2014 coming in at $577,898 – up by 10.1%
- April 2013 it took an average of 23 days to sell a home where in April of this year 20 days down 13.0%
As I mentioned last month, this hectic seller’s market is expected to continue until the end of June.
Buyers are anxious to buy, but with many having unsuccessfully dealt with several multiple offer scenarios, some house hunters may collectively defer their house search until the fall.
For a look at local real estate statistics over the last six months, click on the tabs.
[tabs slidertype=”top tabs”] [tabcontainer] [tabtext]March[/tabtext] [tabtext]February[/tabtext] [tabtext]January[/tabtext] [tabtext]December[/tabtext] [tabtext]November[/tabtext] [tabtext]October[/tabtext] [/tabcontainer] [tabcontent] [tab]Birchcliff – Cliffside Home Sales in March 2014 – 42 homes sold [/tab] [tab]Birchcliff – Cliffside Home Sales in Feb. 2014 – 23 homes sold [/tab] [tab]Birchcliff – Cliffside Home Sales in January 2014 – 15 homes sold [/tab] [tab]Birchcliff – Cliffside Home Sales in December 2013 – 17 homes sold [/tab] [tab]Birchcliff – Cliffside Home Sales in November 2013 – 30 homes sold [/tab] [tab]Birchcliff – Cliffside Home Sales in October 2013 – 32 homes sold [/tab] [/tabcontent] [/tabs]
According to the Toronto Real Estate Board, our local housing market is defined as Birch Cliff/Cliffside and the boundaries can be seen below.
View Birch Cliff / Cliffside in a larger map


